
RECOMMENDED
All Tips
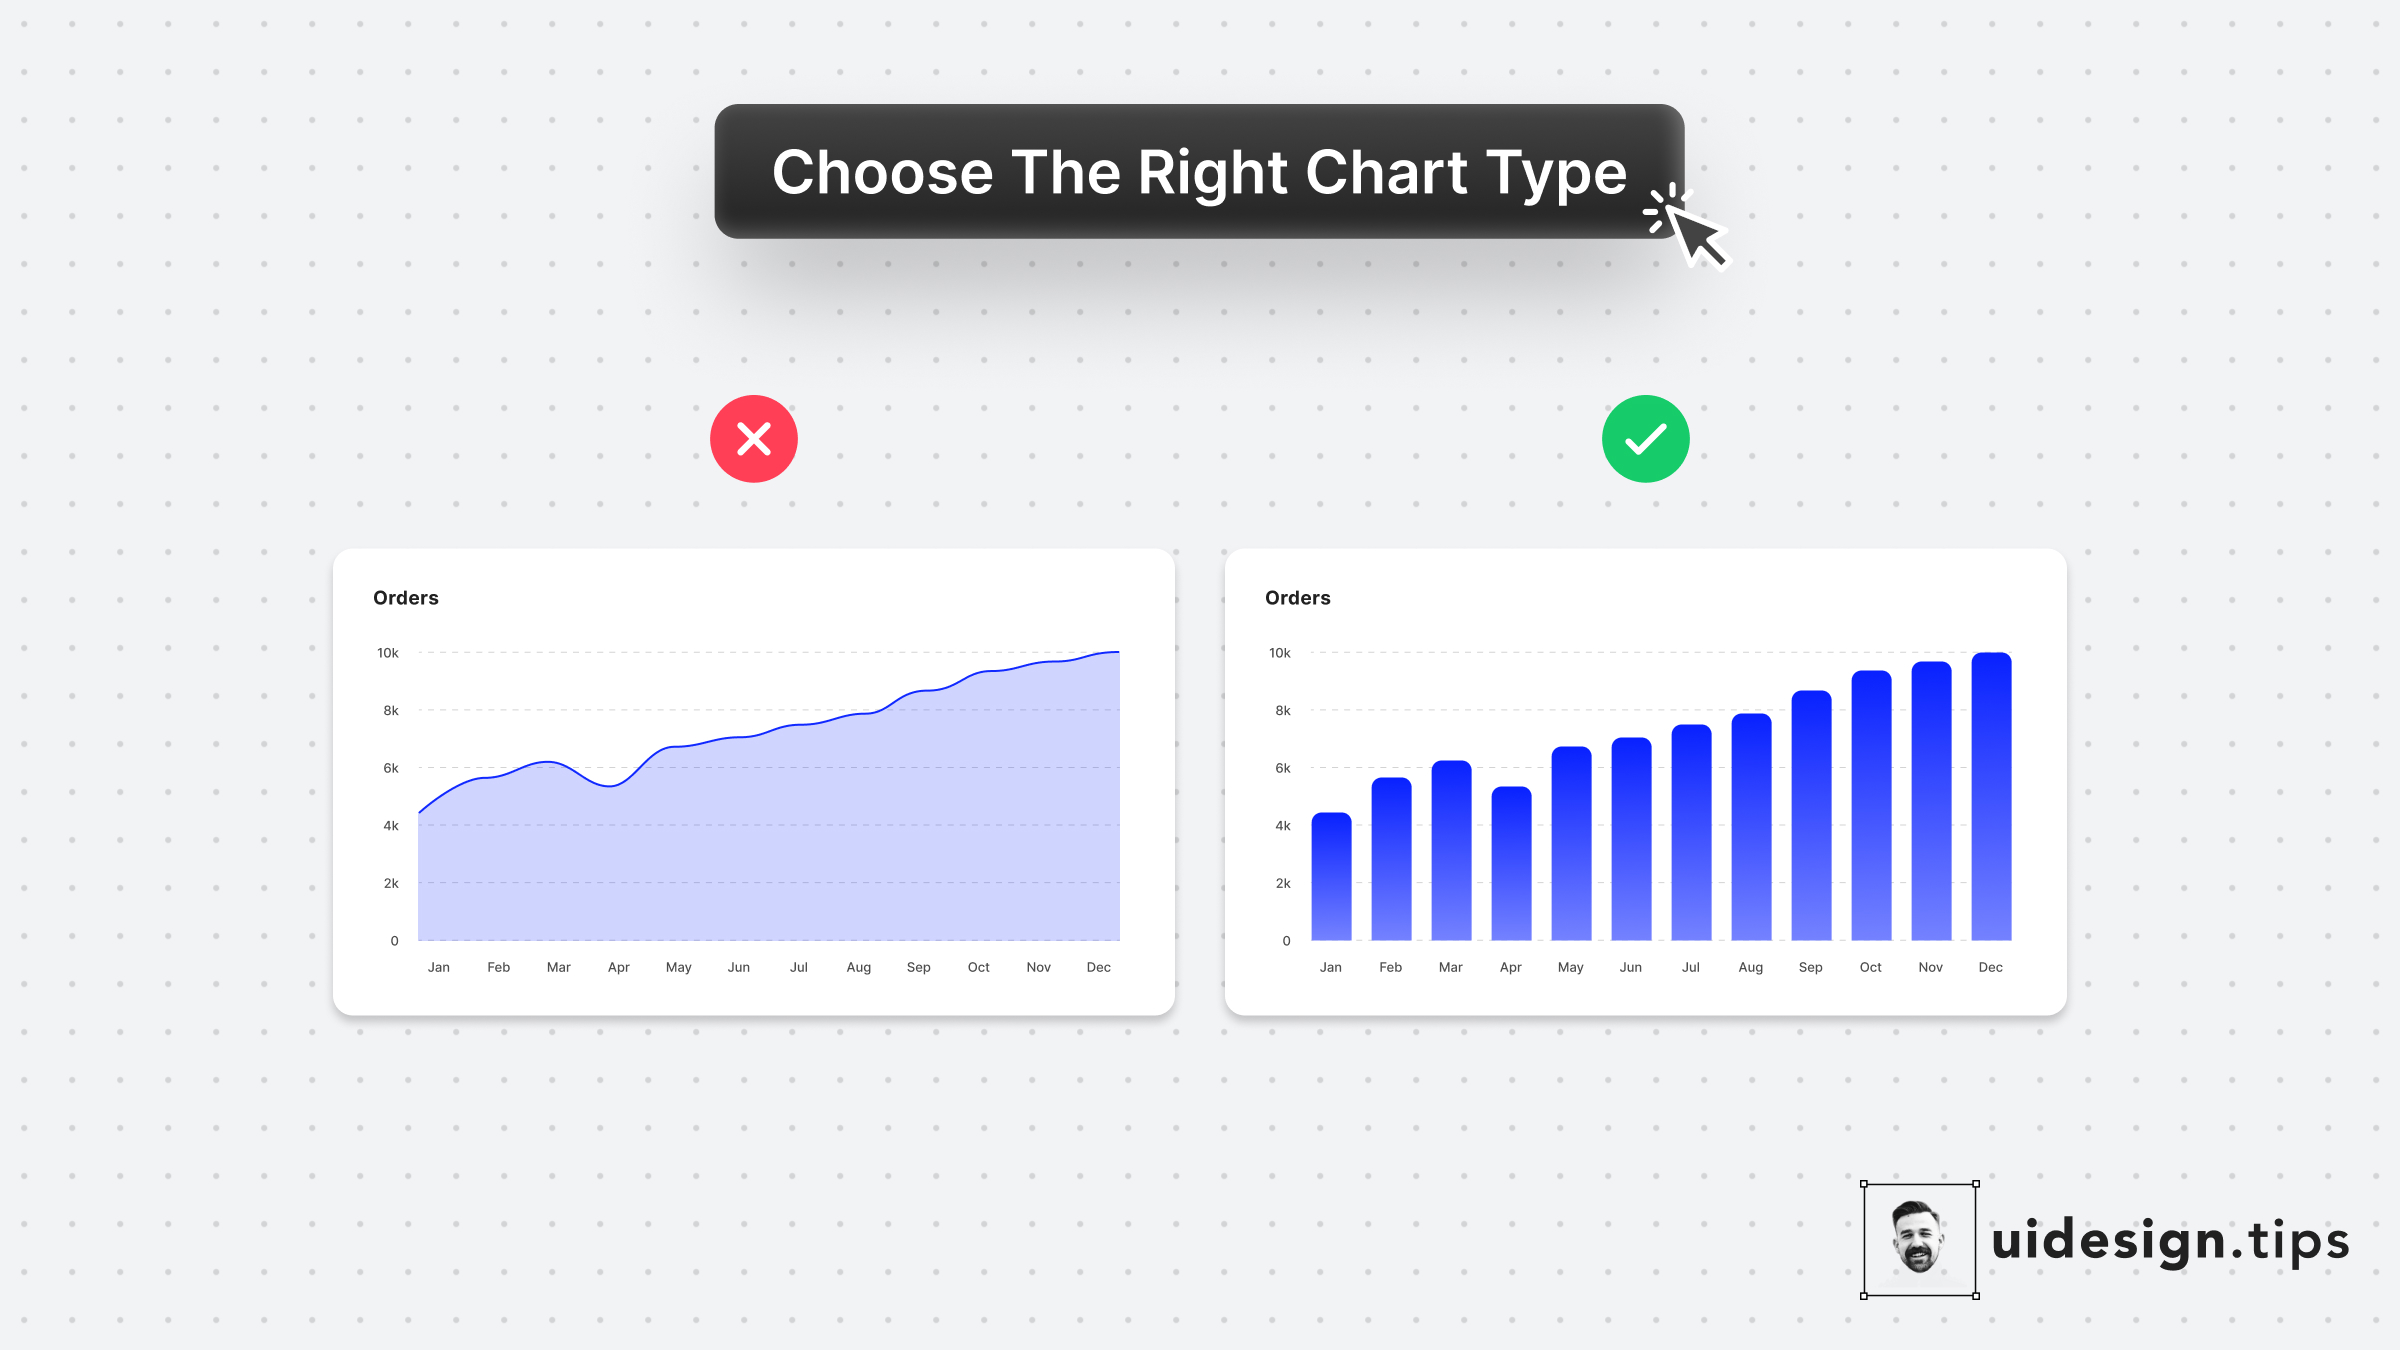
Choose Chart Types Carefully
chart
ux
ui
Line charts might look trendier but they don't apply to every case.
When the x-axis has limited options, a bar chart is the most appropriate graph type.
Plus, the line chart might introduce false intermediate values.
For the specific example, let's say that you only had data for the total monthly orders (not individual days)
The line chart makes the data look daily, which is incorrect!


Become a Better Designer.
The Fun way.
Join 100s of developers, entrepreneurs & junior designers who strive to become better in UI & UX design with byte-sized, practical tips & examples!
Get notified about new tips & articles before anyone else!
"
I love these little tips. It’s like Dribbble but actually useful.
Martin LeBlanc
CEO of Iconfinder
"
I love UX & UI tips. Especially, when they are practical and presented in a very good way. Yours are meeting both criteria.
Lisa Dziuba
Head of Marketing at Abstract